Summary
The "Summary" section in the Pulsar Personal Account provides an overview of your business's key financial and operational performance metrics. It allows you to quickly assess your sales, profits, and product performance, helping you make informed business decisions.
Summary Section
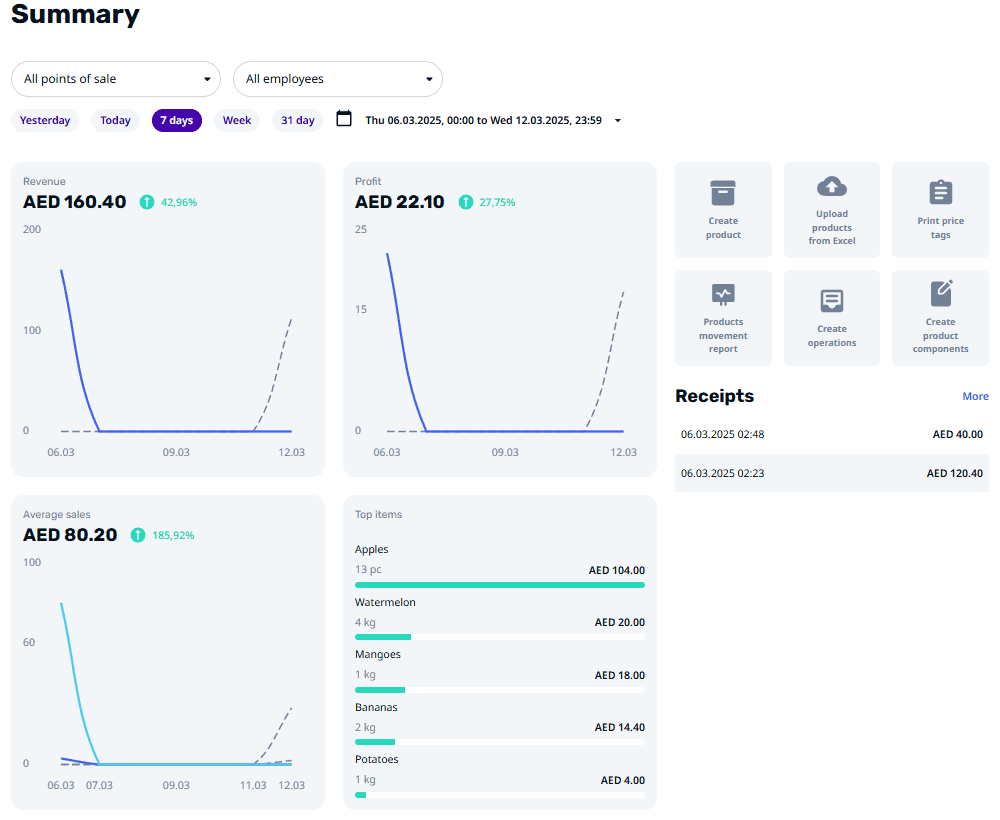
The "Summary" section is divided into several key blocks that display the following data:
Revenue, Profit, and Average Sales Charts
Each chart displays data for the selected period. The horizontal axis shows the days, and the vertical axis represents the respective values (revenue, profit, or average sales). Hover the cursor over a specific day to see the exact value. A green circle with an arrow on the right side indicates the percentage increase or decrease compared to the previous period.
- Revenue Chart: Specifically displays total revenue over the selected period.
- Profit Chart: Specifically displays total profit over the selected period.
- Average Sales Chart: Specifically displays the average value of sales over the selected period.
Top Items
Displays the best-selling products during the selected period. Each item includes:
- 🔹 Product name
- 🔹 Number of units sold
- 🔹 Total sales amount
Click on an item to see more details or adjust product settings.
Quick Action Menu
The Quick Action Menu allows you to perform key product and inventory-related tasks quickly:
- 🔹Create product: Add a new product directly.
- 🔹Upload products from Excel: Bulk upload products using an Excel file.
- 🔹Print price tags: Generate and print price tags for your products.
- 🔹Product movement report: Generate a report on product movements.
- 🔹Create operations: Create inventory control documents (e.g., inventory checking, acceptance, reassessment).
- 🔹Create product components: Create product components for complex products (e.g., a meal composed of multiple ingredients).
Recent Receipts List
Displays the most recent receipts for sales and returns. Each receipt includes:
- 🔹Date and Time
- 🔹Transaction amount
Click "More" to view additional details about receipts.
- 🔹Type of transaction (sale or return)
- 🔹Payment method
- 🔹Discounts
You can also search by the receipt number for quick access to specific transactions.
📌 Note: Data is available for up to 31 days.
Filter Panel
Filters allow you to narrow down the data displayed in the "Summary" section based on:
- 🔹Period: Choose from preset options (e.g., today, last 7 days, last 31 days) or set a custom date range (up to 366 days).
- 🔹Employees: View data by specific employee performance.
- 🔹Shops: View data for a specific store.
- 🔹All points of sale: Includes data for all stores, terminals, and SoftPOS devices available in the personal account.
- 🔹My store - All terminals (default): Displays data for all terminals and phones linked to a specific store.
- 🔹My store: Allows selecting a specific store that, for any reason, doesn't have linked terminals or SoftPOS devices (for example, if terminals have been moved to another store but historical statistics still need to be viewed).
- 🔹My device(s): Enables selection of a specific terminal or phone within the chosen store.
Using the Summary Section for Business Analysis
- 🔸Track Revenue and Profit Trends: Use the revenue and profit charts to identify seasonal changes and performance trends.
- 🔸Monitor Sales Performance: Analyze the top-selling products and average sales to adjust pricing, discounts, or product availability.
- 🔸Identify High-Performing Products: Use the "Top Items" section to focus on stocking and promoting successful products.
- 🔸Compare Employee Performance: Use the filters to see which employees generate the most sales and profit.
- 🔸Monitor Store Performance: Track how different stores are performing and adjust inventory or staff accordingly.
Best Practices
✅ Regularly check the "Summary" section to stay updated on business performance.
✅ Use the filters to dive deeper into performance analysis and find opportunities for growth.
✅ Generate product reports and inventory documents to maintain control over your business operations.